

 WordPress & YOOtheme Pro
 WooCommerce Development
 Website Planning
 Website Ownership & Access
 Website Support & Growth
 Website Launch Checklist
Core Web Vitals for WordPress: Fix the Experience Behind the Measurement
A slow website can fail in several ways. The main content may arrive late. A menu can appear ready while ignoring a tap. A form may shift just as a visitor tries to use it. Installing another optimization plugin without identifying the behavior can change the score while leaving the original frustration unresolved.
Core Web Vitals provide a framework for measuring loading, responsiveness, and visual stability. This guide explains how to turn those measurements into a focused investigation for WordPress, YOOtheme Pro, and WooCommerce pages.
Performance is one part of technical SEO. Here, the goal is a faster, more predictable visitor experience, supported by measurements you can reproduce and compare.
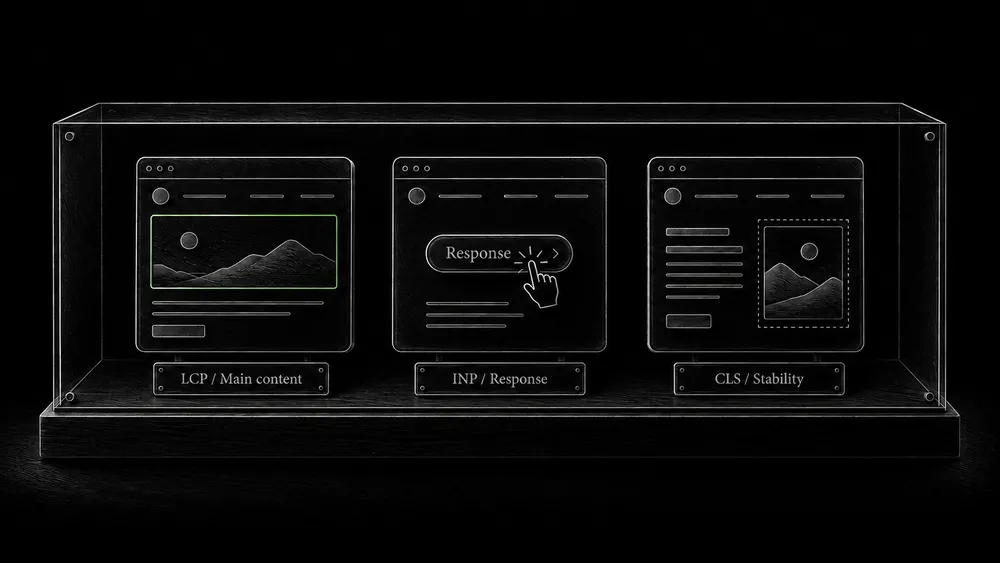
Know what the three metrics measure
| Metric | Experience measured | Good threshold |
|---|---|---|
| Largest Contentful Paint, LCP | When the largest eligible visible content element is rendered | 2.5 seconds or less |
| Interaction to Next Paint, INP | Responsiveness of qualifying interactions | 200 milliseconds or less |
| Cumulative Layout Shift, CLS | Unexpected visual movement | 0.1 or less |
Evaluate these at the 75th percentile, separated by device category. That means the reported value represents the boundary at or below which 75% of the relevant observations fall, rather than an average or your fastest run. Google’s Web Vitals overview defines the metrics and thresholds.
Treat the table as a measurement reference. It does not tell you which plugin caused a delay, and a small change across a threshold is not a guaranteed change in search position.
Google uses Core Web Vitals in ranking, but good results alone do not guarantee top rankings. Its page experience guidance also discourages pursuing a perfect score solely for SEO.
Read field data and lab data as different evidence
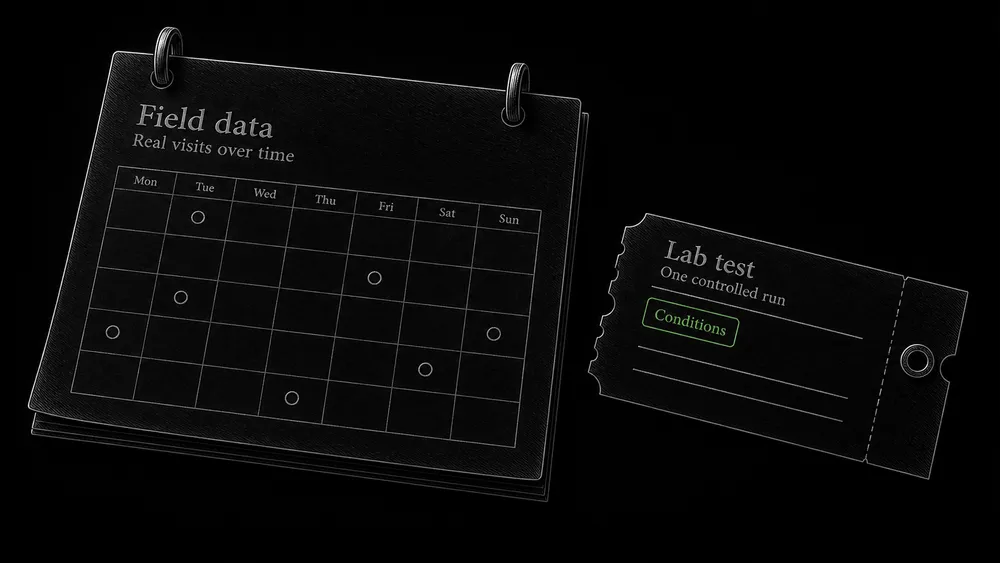
Separate historical field data from a current lab test
PageSpeed Insights combines historical real-user data with a current laboratory test. The real-user data covers a trailing 28-day period. If a URL lacks sufficient samples, the tool may show origin-level data; sometimes neither level has enough data. The PageSpeed Insights documentation explains these distinctions.
Before interpreting a result, record:
- Whether the data describes this URL or the wider origin.
- Whether it describes mobile or desktop visits.
- The collection period and the date of your test.
- Which metrics have sufficient data.
- Whether the observation came from real usage or a simulated run.
Handle missing samples without assuming good performance
Missing field data is not evidence of good performance. It is also not a reason to invent a result for a new website. Use lab measurements and realistic interaction testing while acknowledging the absence of a representative public field sample.
PageSpeed Insights can report a passing assessment with good LCP and CLS when INP lacks sufficient data. That does not mean an unmeasured interaction problem has been ruled out. Read the individual metrics and test the site’s important controls.
Select representative pages and journeys
Choose representative templates and meaningful interactions
A homepage test does not represent every part of a content-rich website. Choose a service page, a long guide, a category or archive, and the important store templates if present.
For each, write the journey to test. On a guide, that could include opening the mobile navigation, following the table of contents, and reaching the inquiry form. In a store, it may include choosing a variation, changing quantity, using a filter, and moving into the cart.
Keep visitor state, device, and network conditions comparable
Include realistic states: a first visit with no stored preferences, a returning visit, and any relevant consent choice. An administrator session can bypass caching or load extra interface elements, so do not use it as your only performance test.
Record device and network conditions. Compare changes under similar conditions and repeat enough runs to see whether the observed difference is stable. Keep the range of results; selecting only the best run produces a misleading before-and-after comparison.
Diagnose LCP by finding where the time goes
Find the LCP element and the delayed part of its timeline
Identify the element reported as LCP on the affected page and viewport. It may be an image or a text block. Do not assume the desktop hero is also the mobile LCP element.
Google’s LCP optimization guide separates the timeline into server response, resource discovery delay, resource transfer, and delay before rendering. This distinction prevents compressing an image from becoming the automatic answer to every slow page.
Inspect the network waterfall and performance trace. If the document arrives late, investigate delivery. If the image request starts late, inspect how it is discovered. If the resource finishes quickly but appears late, examine what blocks its rendering.
Inspect image discovery, loading behavior, and request priority
For a YOOtheme layout, a useful investigation can compare the intended prominent image with its public output: image element or background, chosen file size, loading behavior, and the moment the browser requests it. Keep that observation tied to the actual template rather than assuming every builder element behaves identically.
Do not lazy-load the measured above-the-fold LCP image. Where discovery or request priority is the demonstrated issue, an appropriate preload or fetch-priority adjustment may help. Avoid assigning high priority to every image; Google’s Fetch Priority guide explains how resource prioritization works.
After a change, inspect the same timeline again. Verify that time was removed rather than simply moved into another part of the process. Also check the image quality and mobile crop: a lighter resource still needs to communicate the intended information.
Diagnose INP by reproducing a slow interaction
Record a reproducible slow interaction
Choose an interaction that real visitors use, then reproduce the delay while recording browser performance. A page-load test alone does not exercise every menu, filter, or form control used later in the visit.
INP-related latency can occur before the handler starts, while the handler processes work, or before the browser presents the next frame. Google’s INP optimization guide describes these stages and ways to reduce blocking work.
Make the test specific: “open the mobile menu while the first page load is still active” is easier to reproduce than “the site feels heavy.” Record which scripts or rendering tasks overlap the delayed interaction.
Isolate blocking work and preserve functional behavior
For WordPress, inspect the source of that work before removing a plugin. A particular widget or third-party integration may load across every page even when only one section uses it. A controlled test of that component can help establish its contribution. Keep functional checks in the experiment so an apparent improvement is not simply the result of disabling the interaction.
Distinguish INP from TBT and full transaction time
Lighthouse’s Total Blocking Time is a useful lab diagnostic for blocking work, but it is not INP and should not be relabeled as a field interaction result. The Lighthouse TBT documentation explains that measurement.
INP also does not measure the full completion time of every asynchronous action. A control can paint feedback promptly while a network request continues. The INP definition explains its scope. Test the complete business action separately: a responsive submit button still needs to deliver the inquiry.
Diagnose CLS by identifying what moves and why
Identify the trigger behind an unexpected layout shift
Watch the page during loading and subsequent use. Record the movement, the content inserted before it, and the conditions under which it happens. The shifted element is not always the element that caused the shift.
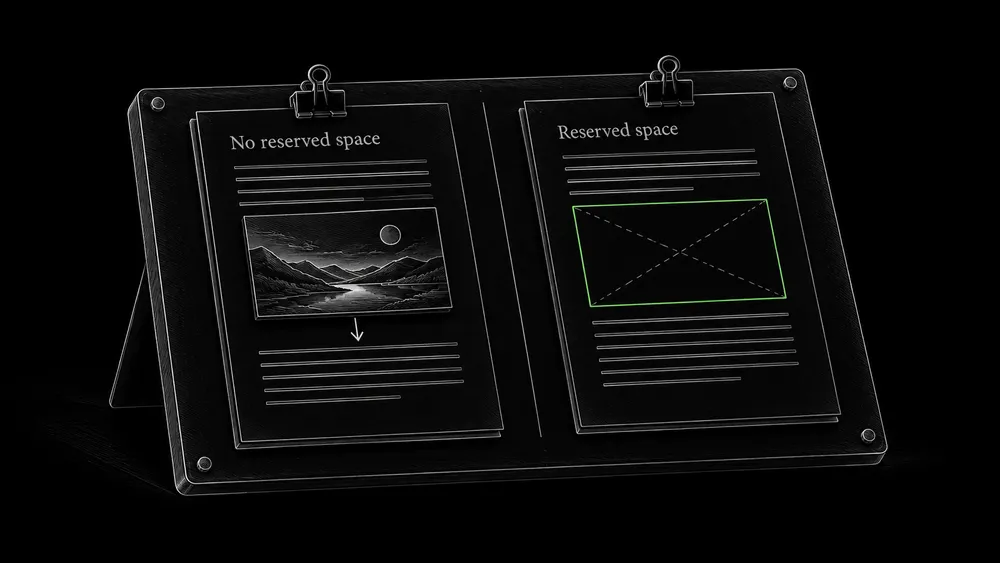
Common causes include media without reserved dimensions, dynamically inserted blocks, embeds, and font changes. Reserving appropriate space can prevent movement while resources load. Google’s CLS optimization guide explains these mechanisms.
Test embeds, feedback, and fonts across page states
Inspect the template in the states where the issue appears: before and after a notice loads, before and after an embedded video becomes available, or while a form displays validation feedback. A single screenshot of the completed page cannot reveal how it arrived there.
For a content-heavy page, check more than the first viewport. Scroll and interact during a recording. A late-loading embed or expanding promotional block further down the article can disturb reading even when the initial screen is stable.
When fonts are involved, compare the fallback and loaded text layout. Google’s font best practices describes strategies for controlling loading and metric differences. After adjustment, verify legibility, wrapping, buttons, and headings across mobile widths.
Choose the implementation layer from the diagnosis
Match the measured bottleneck to the implementation layer
Server caching, object caching, edge delivery, browser caching, image output, and JavaScript behavior address different work. Choose among them based on the measured delay.
If document response time dominates, investigate the server and cache path. If the document arrives promptly but a control blocks the browser, adding Redis is not evidence-based treatment for that interaction. If an image shifts the article after arrival, faster delivery alone does not establish that the layout will remain stable on slower connections.
The WordPress caching guide explains the roles and correctness tests for the caching layers. Keep private sessions and transactional behavior in scope when changing store caching. Performance work must not show one customer’s state to another or preserve outdated purchasing information.
Preserve forms, consent, and checkout when changing scripts
For third-party scripts, establish which pages need them and what business function they support. Evaluate loading and initialization changes against that function. Do not delay form, consent, or checkout code indiscriminately to improve a test score.
Validate the change on the page family, then in the field
Repeat the trace and check related templates
First repeat the original trace under comparable conditions. Confirm that the identified bottleneck changed. Then test other pages sharing the affected template or component.
Keep a record of the URLs, test environment, measured behavior, code or configuration change, and functional regression checks. A useful outcome says which experience improved and what evidence supports it; it does not simply announce “optimized.”
Allow for historical field data when reviewing the repair
Search Console groups URLs with similar experiences and uses field data in its Core Web Vitals report. Its validation process observes a 28-day window rather than triggering a new crawl or instantly resetting historical measurements. The Core Web Vitals report documentation explains this behavior.
Expect a current lab result and a historical field result to differ immediately after deployment. Google’s explanation of lab and field differences is useful when investigating those discrepancies.
Finally, make performance part of template maintenance. Test meaningful changes to media, widgets, scripts, and forms. A website can gradually become slower through several individually small additions, so retain the baseline and the reasons for previous optimizations.
Frequently asked questions
Do I need a PageSpeed score of 100?
Use the score as a diagnostic summary, not a project objective by itself. Prioritize demonstrated visitor problems and verify the relevant metrics. A perfect simulated run does not establish that every real visitor has a good experience.
Why is mobile performance worse than desktop?
The device, network, viewport, content selection, and interaction conditions can differ. Compare the actual traces and field segments. Do not assume the same prominent image or browser task is responsible on both devices.
Which WordPress optimization plugin is best?
Choose a tool after identifying the bottleneck and the functions already handled by the server or other components. Overlapping optimization features make diagnosis and cache invalidation harder. The best configuration for the site is the one whose behavior you can explain and verify.
Can long useful articles perform well?
Article length alone does not describe loading or interaction cost. Inspect media, embeds, scripts, layout, and the delivered page. Preserve useful content while improving how the browser receives and presents it.
Why did the lab result improve while the field result stayed the same?
The field result includes earlier visits and a wider range of conditions. Confirm the deployment date and data scope, then continue observing. Also check whether your lab test reproduced the interaction or page state responsible for the real-world problem.
Does a low INP mean checkout or a form completes quickly?
It describes interaction responsiveness within the metric’s scope. Network processing, external services, and delivery can still take time or fail. Test the complete transaction or inquiry path in addition to the performance metric.
What should I send for a performance review?
Send the slow URL, the device or action where you notice the issue, and a PageSpeed or Search Console report if available. A clear description such as “the mobile filter freezes after selection” is more useful than an unexplained score.
Improve the experience that is slowing visitors down
I can investigate performance within a new WordPress build, an agreed development project, or a focused review. Share the affected pages and the behavior you want to improve so the work can begin with a measurable problem.